I recently had a short piece in the Washington Post’s Monkey Cage blog. Below is the original long(er) form version of the piece with a few more graphs and tables for those interested.
American politics may be more polarized today than at any time in the post-war period. Long defined by big-tent parties that eschew ideology in favor of political compromise, American politics is increasingly characterized by intense partisan struggles, gridlock, and party-line voting. Political polarization has not been limited to political elites. Public opinion data reveal a significant increase in ideological polarization of Americans over the past two decades with partisan animosity at their highest levels since at least 1980.
While it is common to lament the decline of civility in politics as well as the apparent collapse of space for bipartisan compromise, what is less well noted is that polarization may improve the ability of citizens to identify the policy positions of the major political parties. Though identifying the basic positions of the parties and candidates may seem trivial to those who follow politics closely, decades of research on the American voter consistently uncovers shockingly low levels of political knowledge about key elements of the democratic process including basic policy facts, which parties are in power, and the basic institutional structure of government. Voters struggle to identify the positions of parties and candidates on major issues, calling into question their ability to demand representation or accountability from elected officials.
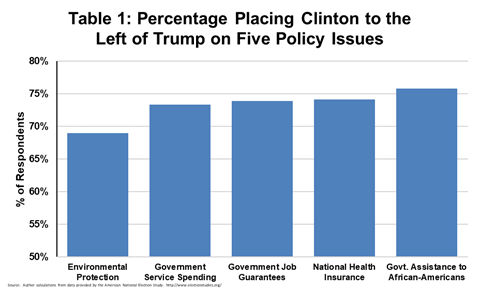
In regards to this last issue, evidence from the most recent election provides reasons for both optimism and concern. The most recent round of the American National Election Survey (ANES) conducted during the 2016 election examined citizens’ perceptions of the positions of Clinton and Trump on 5 issues: environmental protection, spending on government services, the responsibility of government to guarantee jobs, government health insurance, and government assistance to improve the standard of living of African Americans. For each of these policy issues, respondents were asked to place Clinton and Trump on a sliding scale between two positions traditionally associated with the political right and left. For example, individuals were asked to place each candidate on a seven point-scale according to whether the candidate supported either a “government insurance plan which would cover all medical and hospital expenses” or “medical expenses should be paid by individuals and through private insurance like Blue Cross.” Though the presidential debates and campaign rhetoric did not always center on policy, for each of these five issues Clinton took a position clearly to the left of Trump. Using citizens responses to these questions, thus gives us insight into whether Americans can identify the relative positions of the parties and candidates by determining how many would place Clinton to the left of Trump on each issue (e.g. Clinton is more likely to support government health insurance than Trump).
Table 1 presents the percentage of respondents who correctly placed Clinton to the left of Trump on each of the five policy issues. Whether the results from Table 1 are cause for concern or optimism depends upon your perspective. Strong majorities of Americans appeared to recognize that Clinton stood to the left of Trump on each of the issues, suggesting that most people were at least minimally informed about the positions of the candidates. At the same time, the numbers reveal that despite the centrality of the repeal of the Affordable Health Care Act to the Trump campaign and Clinton’s long association with national health care dating back to Bill Clinton’s presidency, 1 in 4 citizens either could not determine whether Clinton or Trump were more likely to support government health insurance or believed Trump was more likely to support national healthcare than Clinton.
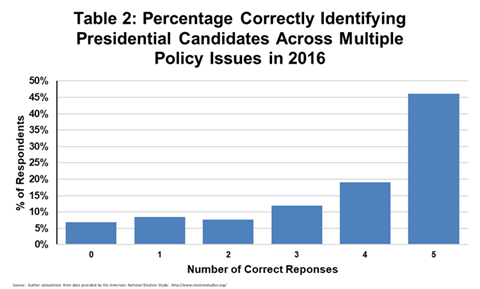
Looking at each issue separately also likely exaggerates the knowledge of voters. Because simple random guessing would allow you to place Clinton to the left of Trump around 43% of the time, these majorities almost certainly contain large numbers of random guessers who just got lucky. To partially correct for this guessing, Table 2 looks at the percentages of voters who could consistently place Clinton to the left of Trump across all five policy issues. The results reveal that about 2/3rds of Americans correctly identified the relative positions of the candidates on at least 4 of the 5 issues, while 23% did so 2 or fewer times. Again, this evidence suggests, that at least 1 in 4 voters are largely incapable of identifying the positions of the Presidential candidates.
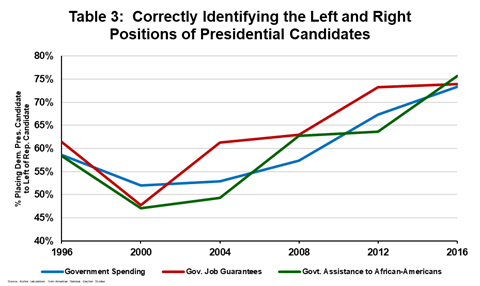
These results paint a less than rosy picture of the American electorate, yet those who study political knowledge and thus take a longer view of the data might be quite surprised at how well the public performed in 2016. For 3 of the 5 policy issues (spending on government services, the responsibility of government to guarantee jobs, and government assistance to African Americans), the ANES allows us to compare how well citizens in 2016 compare to those trying to identify the positions of presidential candidates in earlier years. Table 3 documents the percentage of Americans who placed the Democratic presidential candidate to the left of the Republican candidate for each presidential election dating back to 1996. Though there are some differences, all three policy-issues appear to follow a similar trajectory in which they begin in 1996 with around 66% of respondents correctly identifying the relative positions of the candidates, with this number falling to around 50% in the Bush-Gore election of 2000. Since that time, the ability of respondents to correctly identify the relative positions of the candidates has steadily and significantly risen.
What can explain why citizens are better able to identify the relative positions of the candidates? It is possible that citizens are paying greater attention to politics, but little evidence exists in the ANES of growing interest in or attention to politics in the past few years. Another explanation lies in the much-maligned polarization of American politics. By drawing clearer and more consistent lines between parties and candidates the realignment and polarization of parties may make it significantly easier for even disinterested voters to identify the relative positions of the two parties and their presidential candidates. If so, polarization might be improving the chances that even a relatively uninformed public might hold vital information about the general policy stances of the parties and candidates, allowing them to make better informed votes. If so, then the often-maligned polarization of politics may improve accountability and representation by simplifying the points of real conflict between parties.


