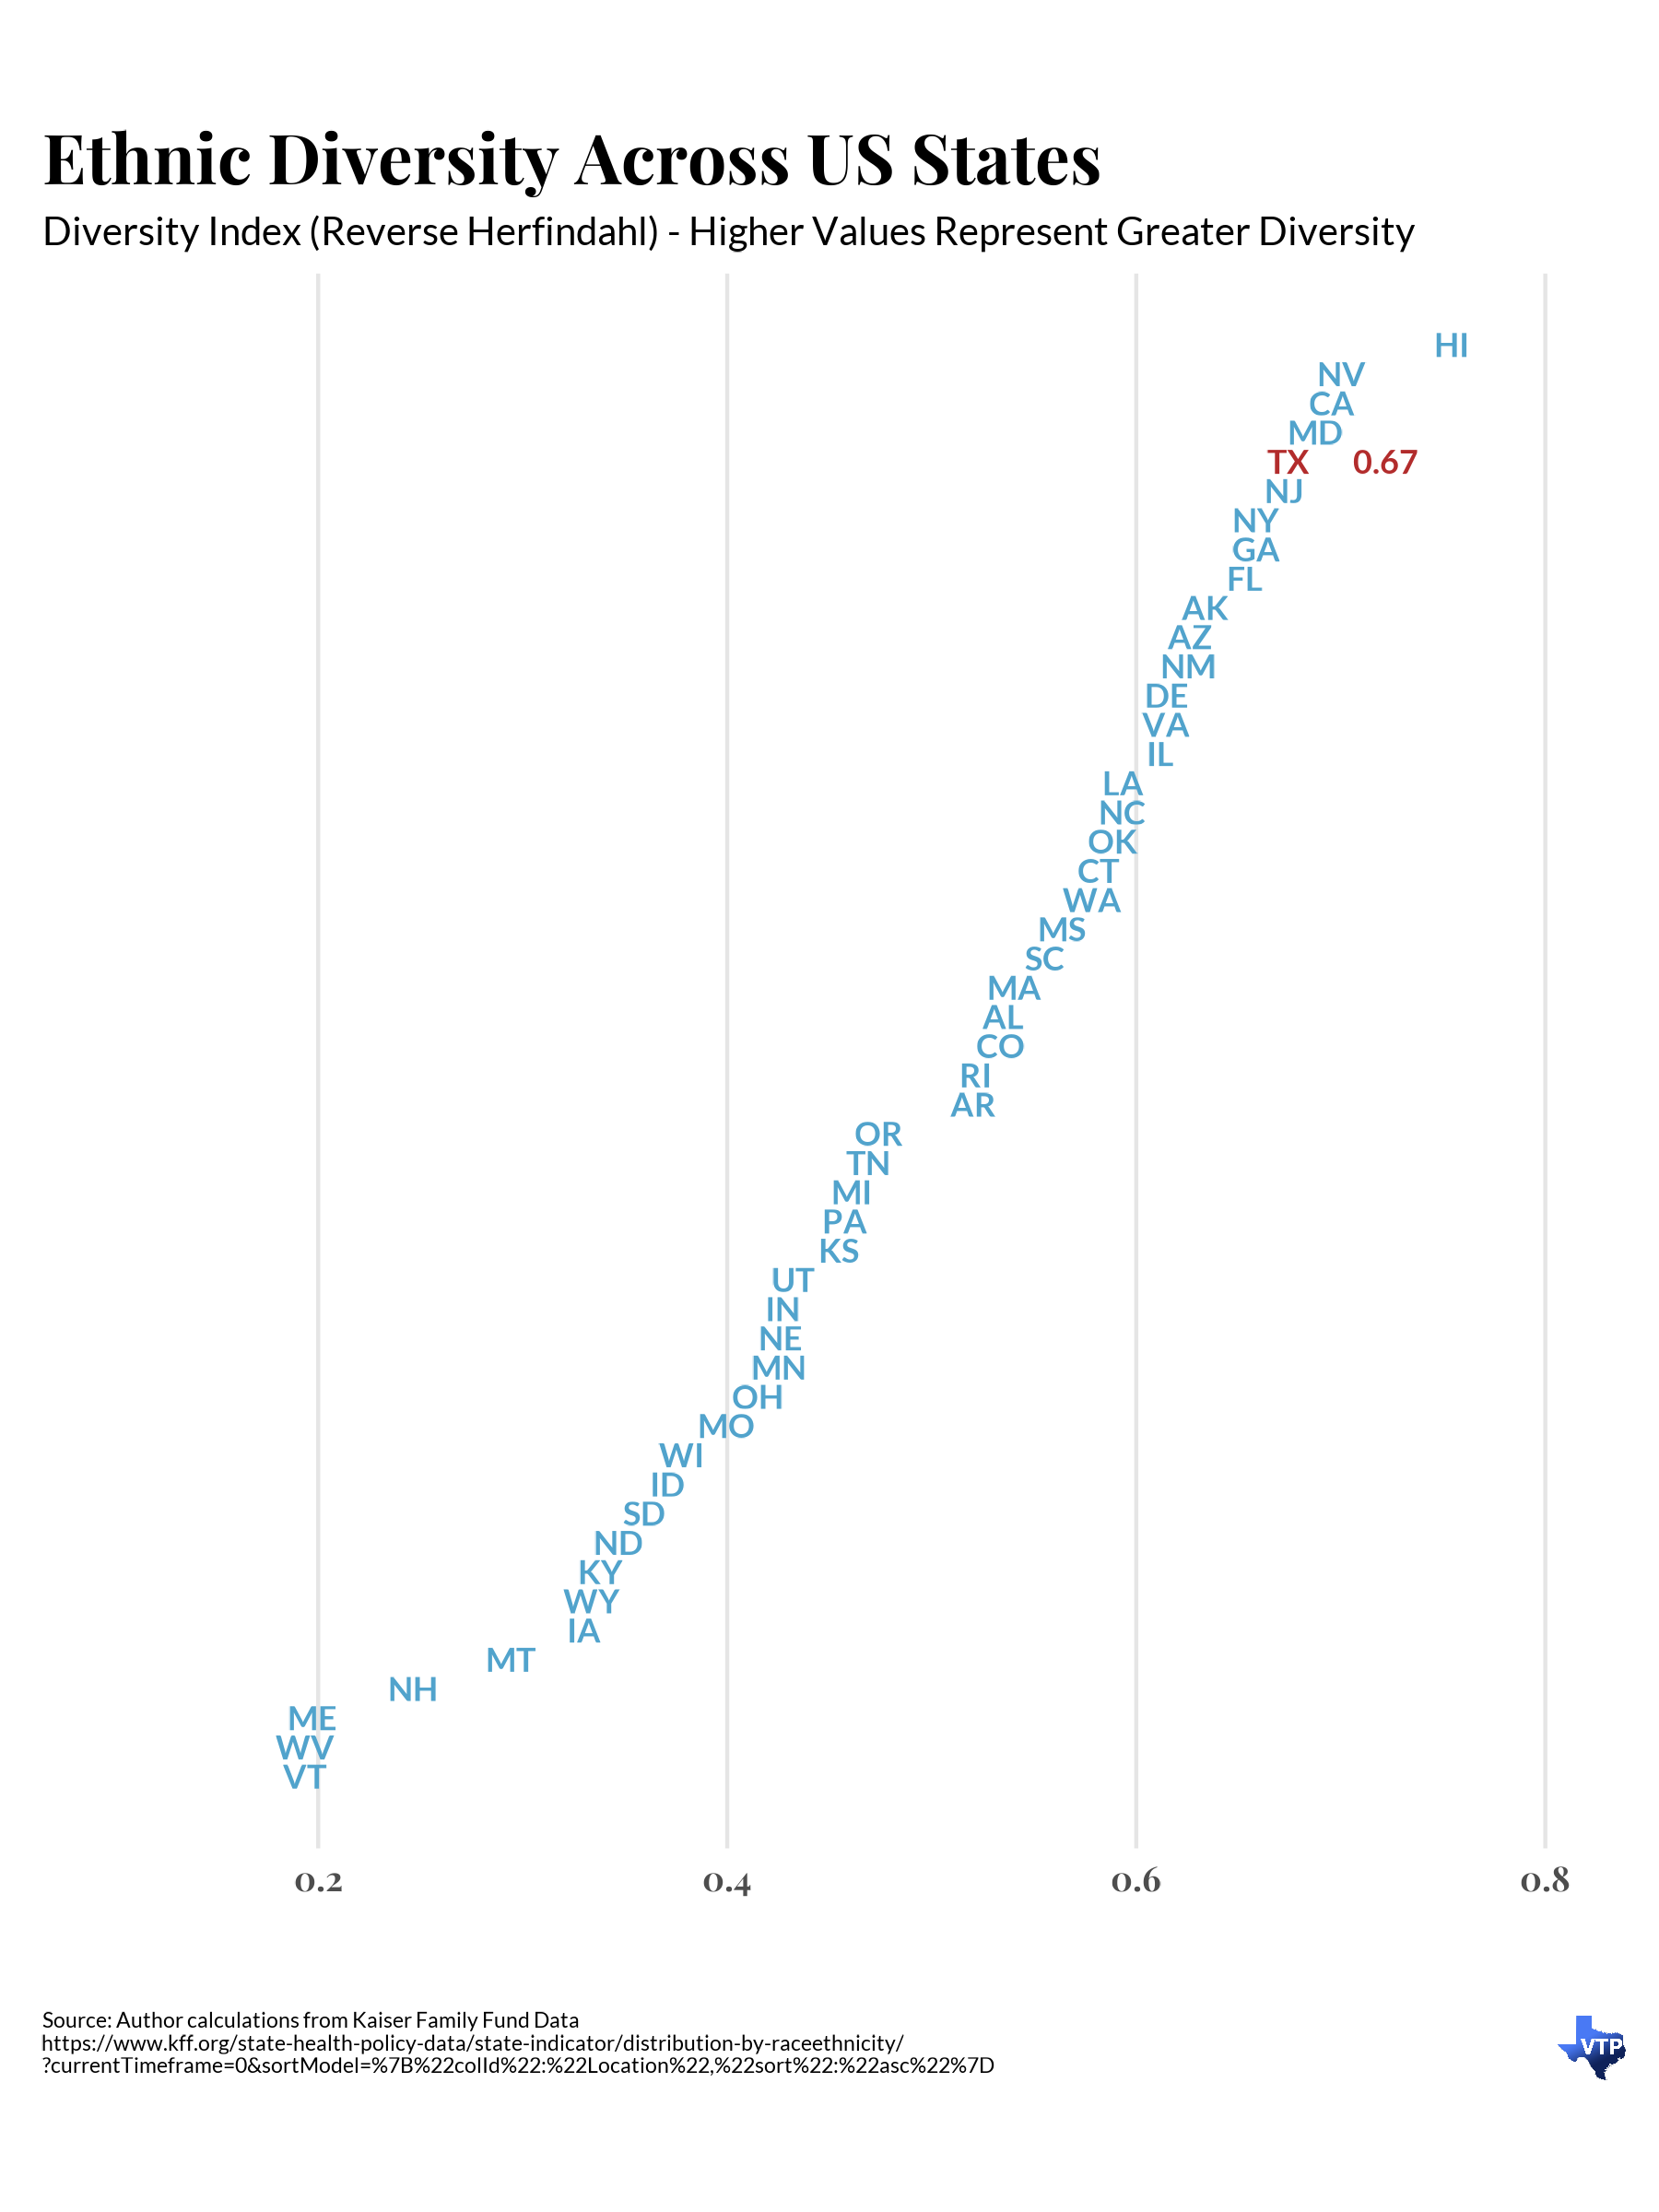
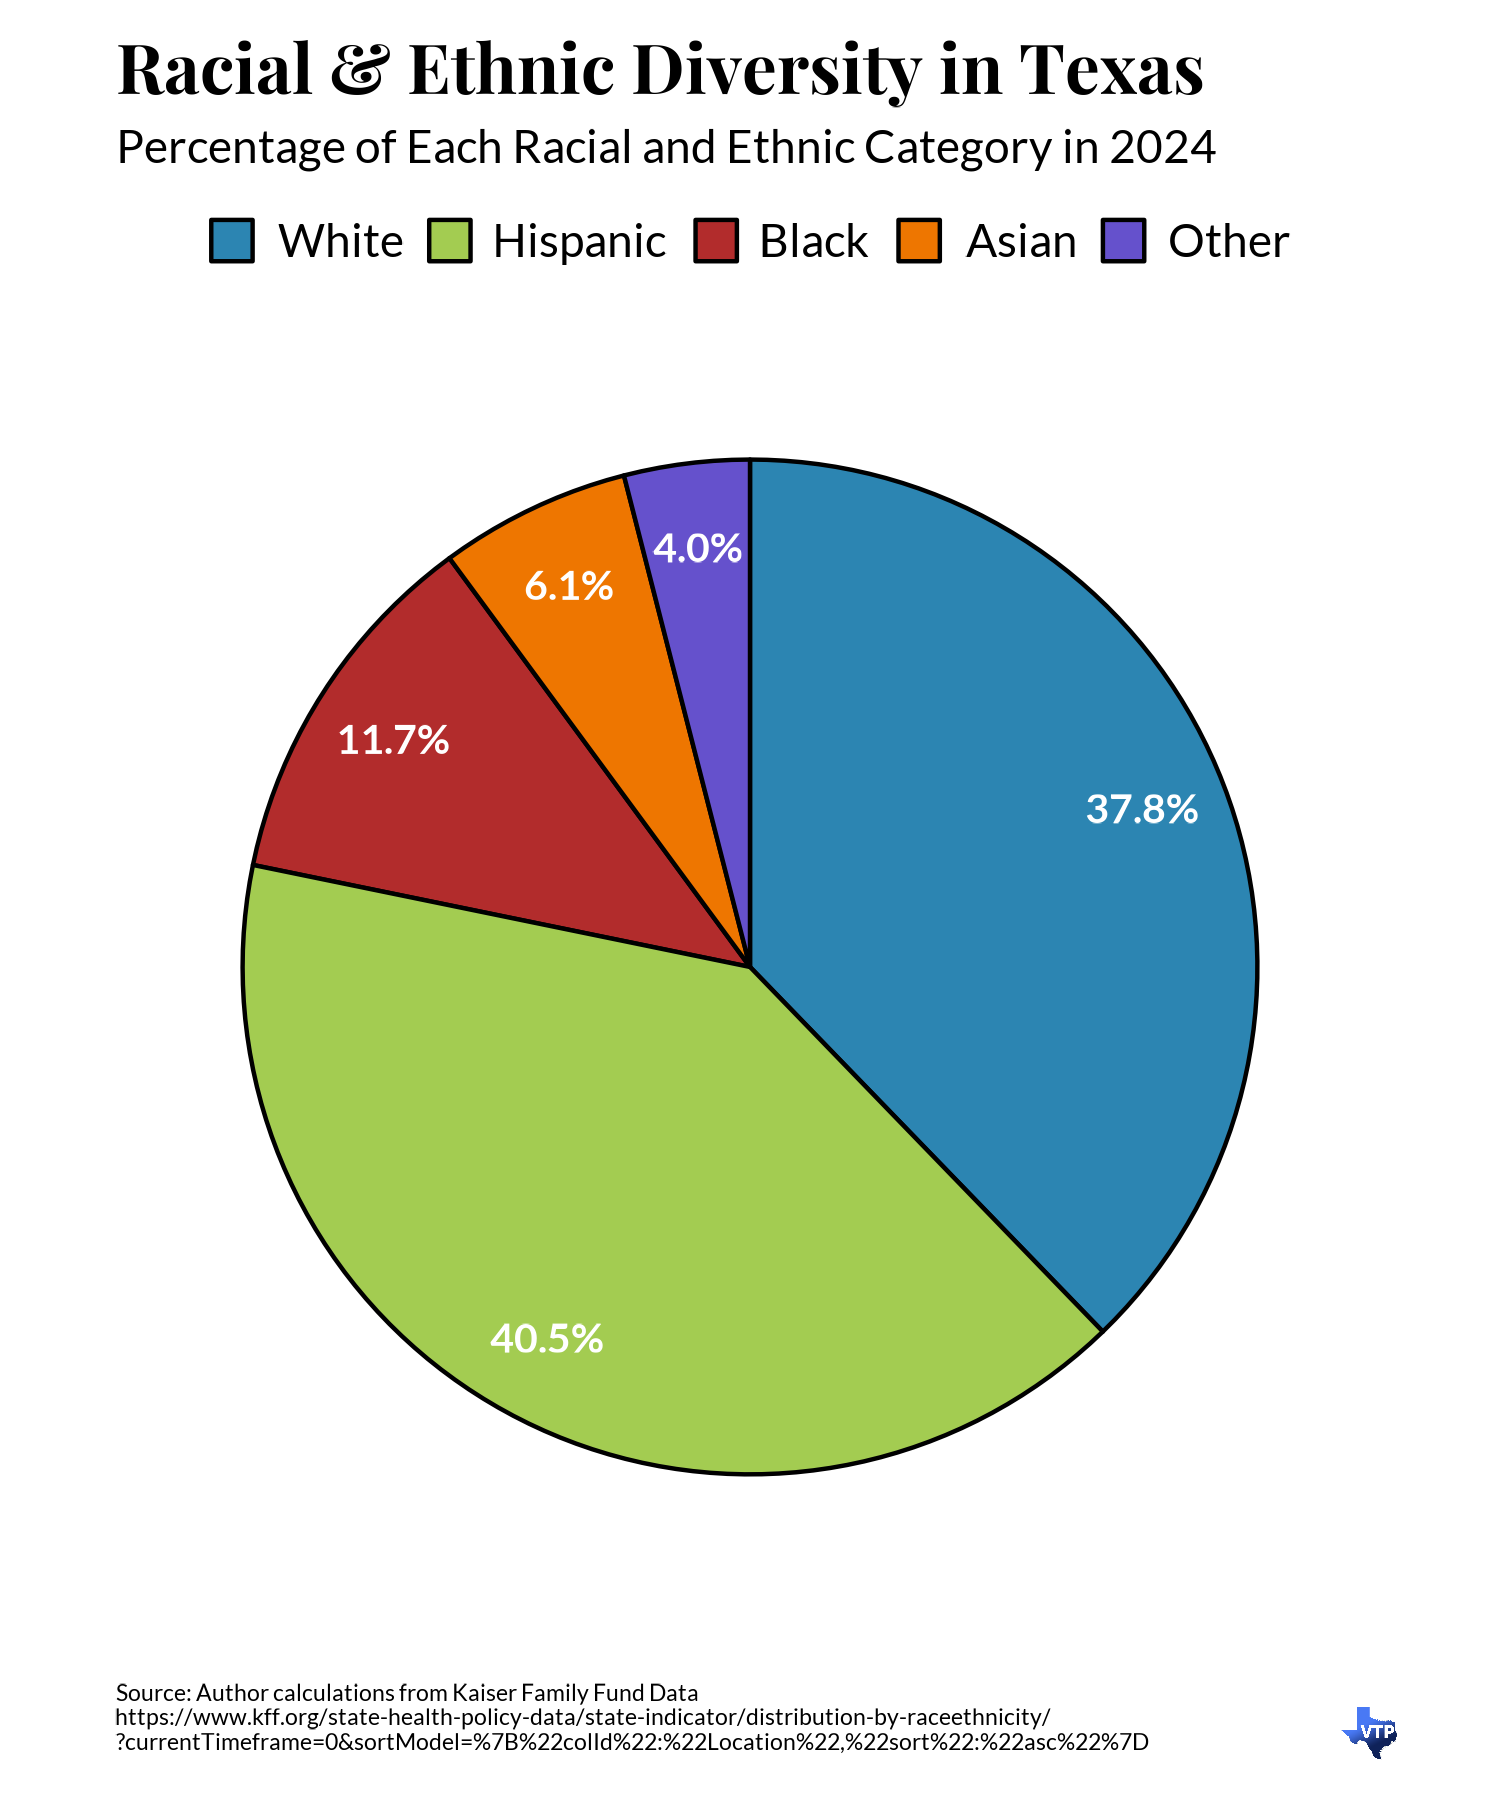
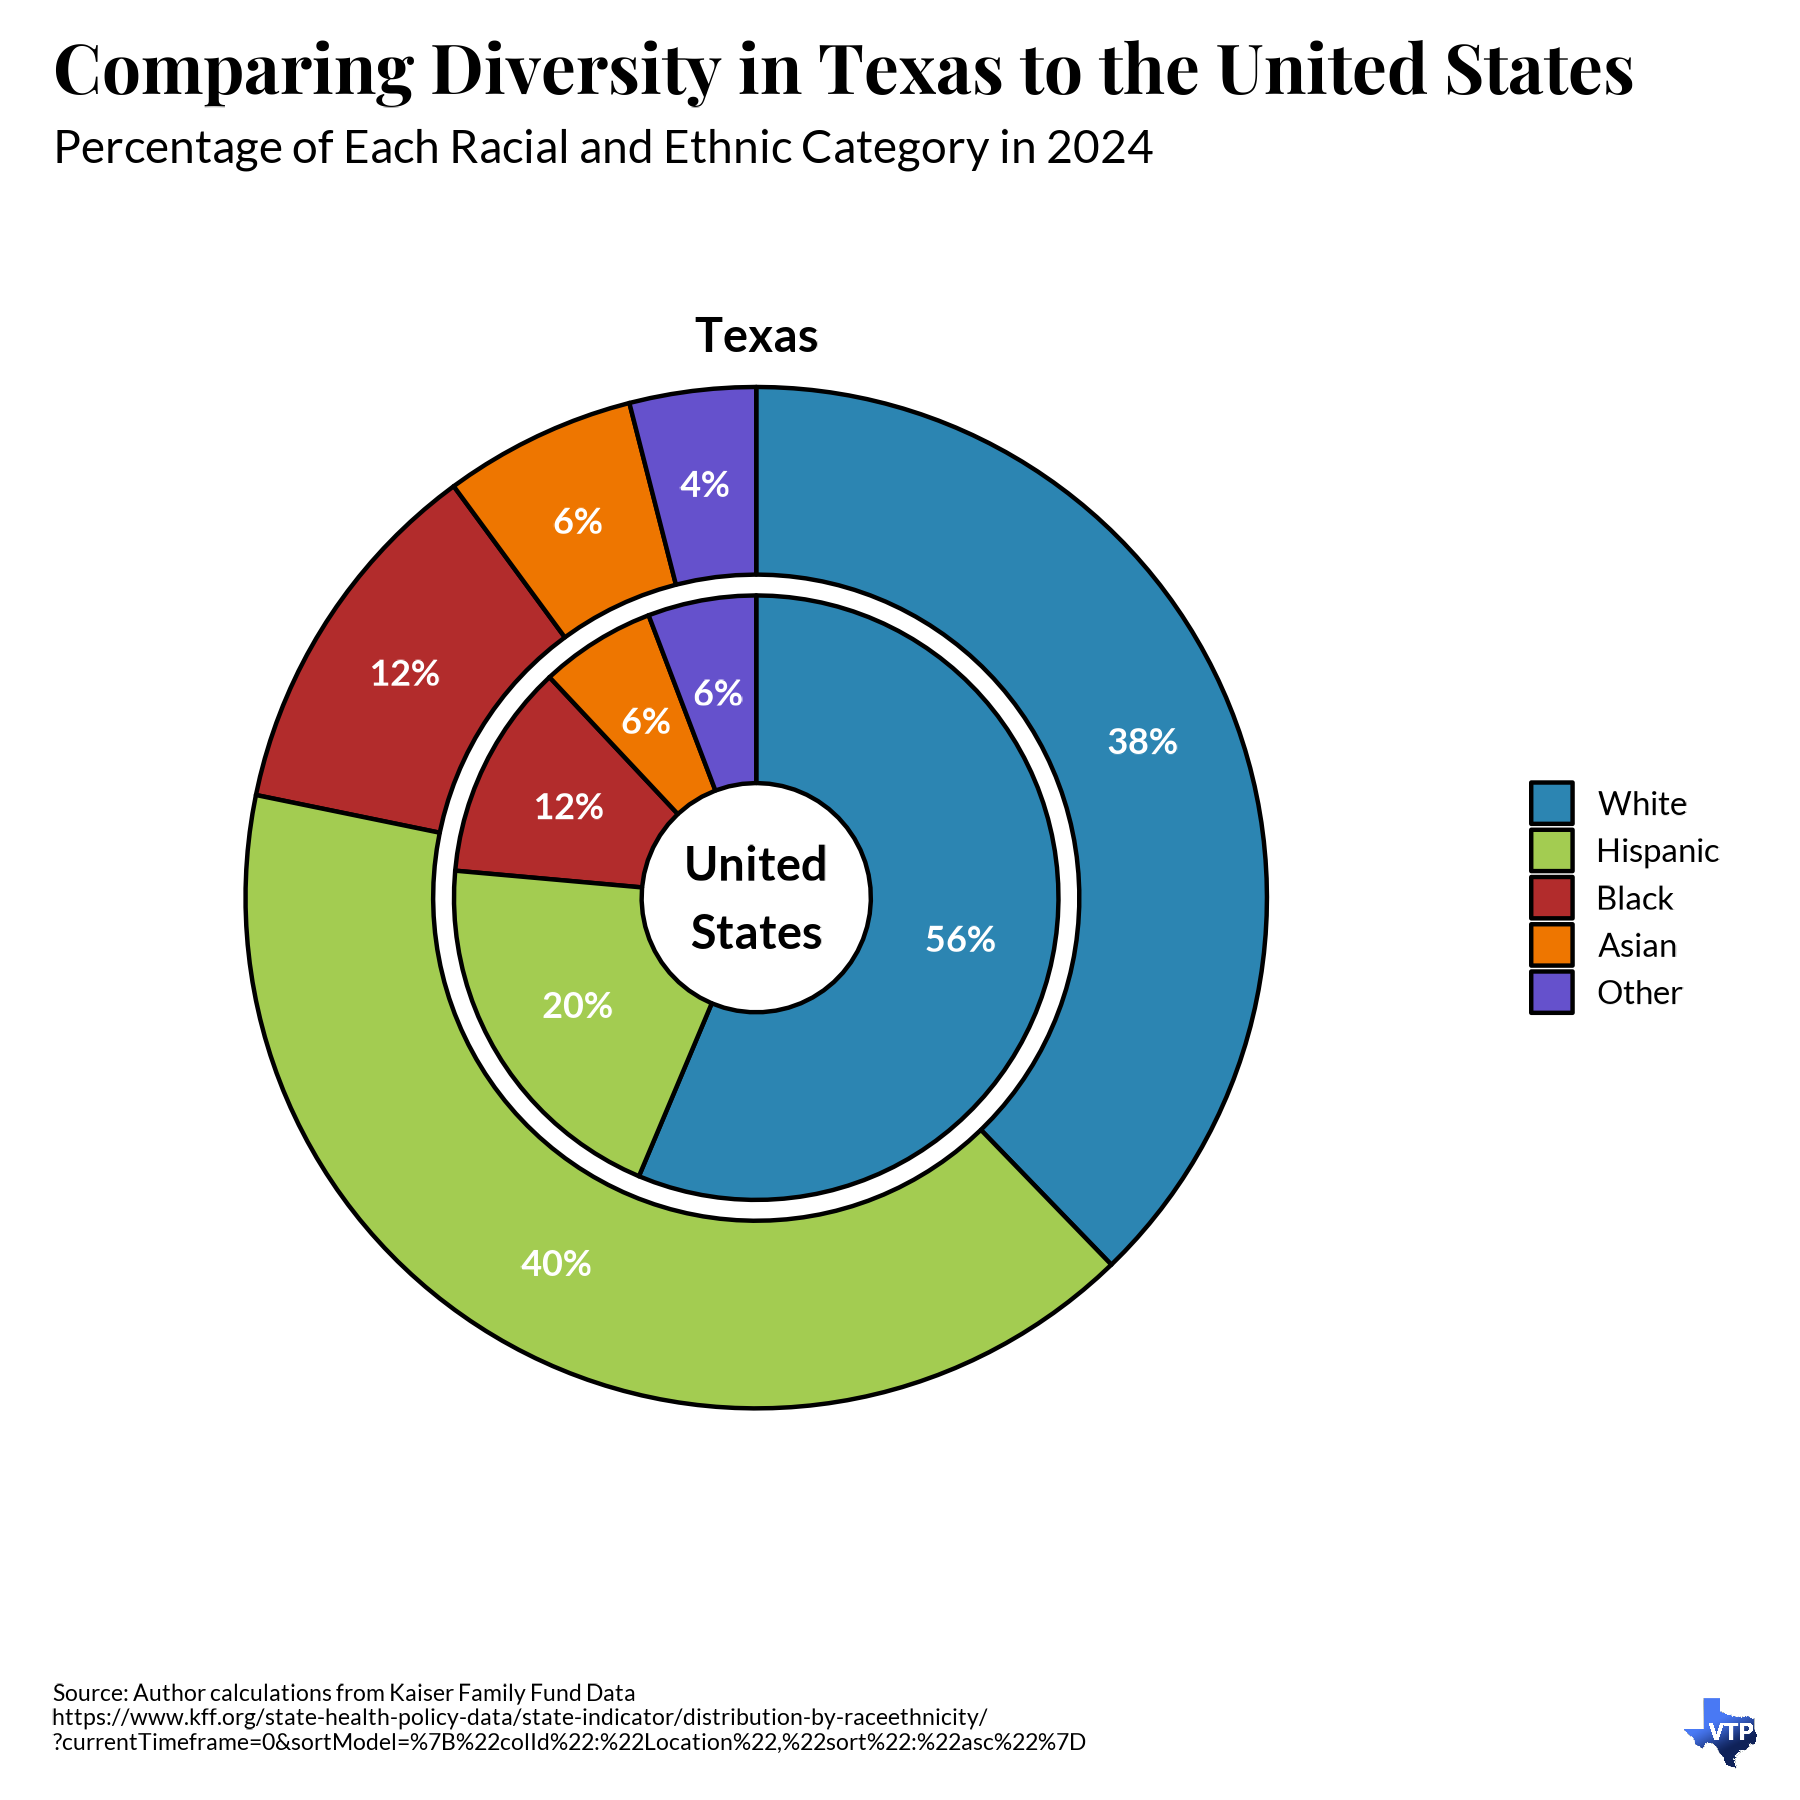
Texas is one of the most racially and ethnically diverse states in the country. Representing this diversity in numbers is inherently problematic as the boxes people are placed in to count them never adequately reflect the real complexity and diversity of our individual lived identities. Despite that shortcoming, some numbers can help to paint a broad strokes picture of the ethnic and racial makeup of Texans and how that compares to the rest of the country. Below are two pie charts that provide an overview.
Social scientists commonly represent and compare diversity across different countries or states through the use of an Ethnic Fractionalization Index, which is formally the inverse Herfindahl-Hirschman Index. This number represents the probability that two people drawn randomly from a state are from the same ethnic or racial group with higher numbers reflecting greater diversity. At the extremes, if everyone has the same ethnic and racial identity the index is zero (i.e. it is not possible to find two people who are different). Alternatively, if every person has their own unique identity, the number is one (i.e. the two people you pick are always different). The graph below shows this diversity index across the US states. If you’d like to learn more about the HHI and other measures of diversity you can read about them here.